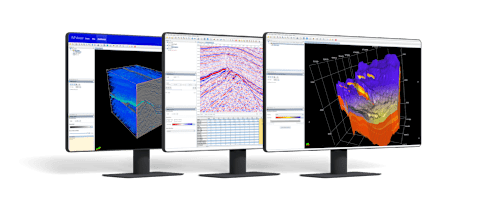
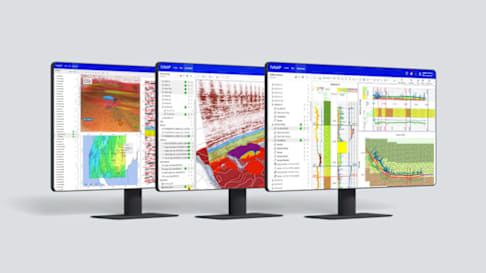
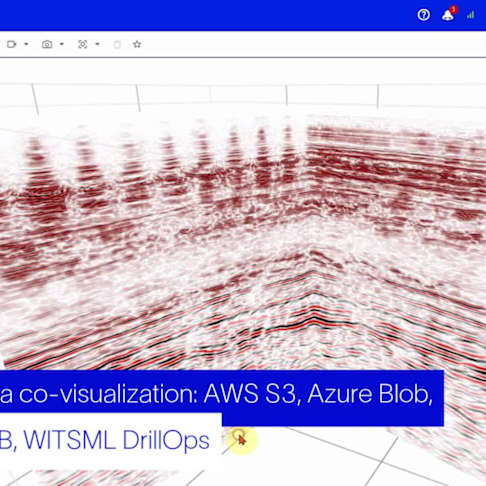
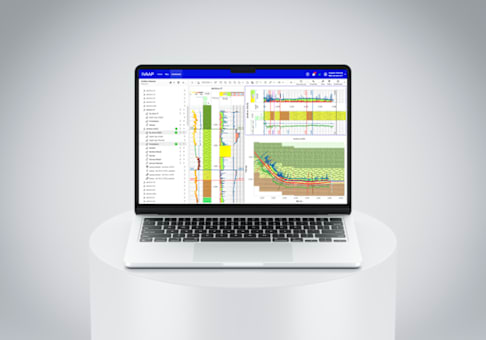
INTViewer is a platform and application that allows you to view your seismic data, check for errors, confirm geospatial integrity, perform light processing, and analyze your dataset. INTViewer is specifically designed to quickly access large datasets—prestack, stack, and 2D—from a laptop in the field to a desktop or remotely via the cloud. As a platform, INTViewer makes it easy to add or implement proprietary features on your own to meet the specific needs of your project, and with a simple Python script, you can automate your analysis. Or you can use INTViewer right out of the box as a complete application to work with your data instantly.
INTViewer features
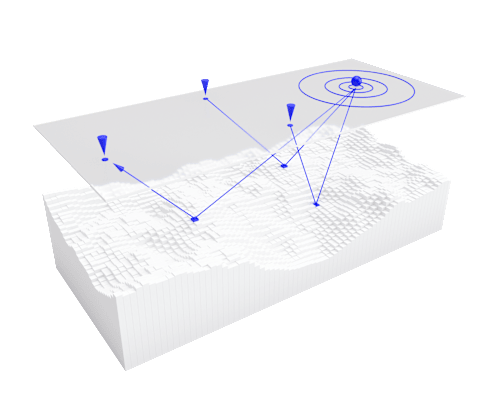
QC Your Seismic Data
Whether you are working with legacy data or acquiring seismic data in the field, INTViewer makes it easy to
Perform Light Processing
As a lightweight application, INTViewer can perform pre-processing using your
Analyze Your Data
Add your own processing library, proprietary workflows, and trace processors.
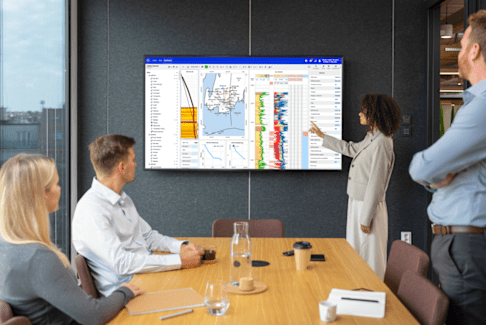
Present Your Findings
Create portable datasets for presentations on your desktop or laptop with
Customize Your Workflows
Add your custom algorithm, create custom w...
Automate Your Steps
Built-in Python scripting helps you automa...
Who is INTViewer for?
INTViewer is primarily designed for geoscientists, geophysicists, seismic processing teams, energy/mining companies that work with large seismic and subsurface datasets, and any professional who needs a fast, customizable tool to QC, analyze, interpret, and manage seismic and other geoscience data.
Seismic capabilities
Seismic acquisition and processing QC
Inspect headers and sample values.
QC seismic frequency and analyze sources of noise, all in the same window.
Detect data anomalies using frequency-time analysis.
Seismic gathers data QC
Display Gathers on new Cross-Section Window
Display Gathers using Variab...
Seismic stack initial QC scanning
Display the SGY data
Check SGY metadata (EBCDIC and Binary headers)
Seismic stack data QC
Display a subset of the dataset
QC seismic frequency and amplitude distr...
Seismic analysis and interpretation
Visually check the positioning and accuracy of the survey and CRS used.
Analyze attributes of your seismic dataset.
Visualize microseismic data, available in 2D and 3D.
Analysis
Spectrum
FK, FT, FX
Interpretation and processing
Interpretation
Horizon pickin...
Data management
Convert files from one format to another
Save subsets to disk (by range,...
Extend INTViewer with prebuilt plugins or create your own
Heading 1
Heading 2
Heading 3
INTViewer’s architecture offers more than 60 plugins, or you can build your own to create a truly custom solution. Some of the current key plugins (2D/3D) include: Well, Seismic, Reservoir, Fault, GUS, PointSet, GridSurface, GOCAD, Normalization, Cross-Plot, Trace Display, Grid Surface, Well Histogram, Velocity Measurement, Horizon Picking, Horizon Calculator, Fault Picking, and many more.
Find answers to common questions about INTViewer software
What is INTViewer software?
INTViewer is a geoscience visualization and analysis platform that enables users to view, QC, analyze, interpret, and manage seismic and other subsurface datasets from a desktop, laptop, or cl...
Who is INTViewer designed for?
INTViewer is designed for geoscientists, geophysicists, seismic processing teams, and organizations in the energy and mining industries that work with large seismic and geoscience datasets.
Does INTViewer support automation?
Yes. INTViewer includes built-in Python scripting capabilities that allow users to automate data loading, processing, analysis, and other repetitive workflows.
Can I customize INTViewer for my organization's needs?
Absolutely. INTViewer supports prebuilt plugins and custom plugin development, enabling organizations to add proprietary algorithms, workflows, and integrations.